
Crop Insights
Written by Mark Jeschke, Ph.D., Agronomy Manager
Key Points
- Improved hybrids and production practices are helping corn growers increase yields. Over the past 20 years, U.S. yields have increased by an average of 1.6 bu/acre/year.
- The NCGA National Corn Yield Contest provides a benchmark for yields that are attainable when conditions and management are optimized.
- The 2023 contest had 431 entries that exceeded 300 bu/acre, the most ever to attain that yield level.
- Pioneer® brand products were used in 176 NCGA National Corn Yield Contest entries that topped 300 bu/acre in 2023, as well as 205 state-level winners.
- Plant populations in high yield entries were generally above average but not extraordinarily high, with most falling between 34,000 and 38,000 plants/acre.
- High yield entries tended to be planted relatively early; however, there were numerous instances where 300 bu/acre yields were achieved with late May or early June planting.
- The vast majority of high yield entries were planted in 30-inch rows, reflecting overall industry trends.
- Nearly 75% of 300 bu/acre entries included some form of in-season nitrogen application.
Related Articles
- Yield-Limiting Factors in Continuous Corn Production
- Crop Management in a Changing Climate
- Corn Grain Yield in Relation to Stress During Ear Development
Benchmarking Corn Yield
Since the introduction of hybrid corn nearly a century ago, corn productivity improvements have continued through the present day. Over the last 20 years, U.S. corn yield has increased by an average of 1.6 bu/acre per year. These gains have resulted from breeding for increased yield potential, introducing transgenic traits to help protect yield, and agronomic management that has allowed yield potential to be more fully realized.
As growers strive for greater corn yields, the National Corn Growers Association (NCGA) National Corn Yield Contest provides a benchmark for yields that are attainable when environmental conditions and agronomic management are optimized.
2023 NCGA National Corn Yield Contest Trends
The 2023 growing season was overall a good but not great year for corn yields. The USDA estimated average yield was 174.9 bu/acre, which was up slightly from 2022 but still below the long term trendline. Corn yields were flat or down compared to 2022 in Minnesota, Wisconsin, Illinois, Iowa, Missouri and Virginia but up in most other states. Indiana, Ohio, and New York set new record highs, as did a cluster of southern states including Tennessee, Alabama, Georgia, and South Carolina.
Drought was the major yield-limiting factor in 2023 with much of the central and northern Corn Belt under some degree of drought stress throughout much of the season. However, high corn yields were still achieved in the NCGA National Corn Yield Contest across many states, including those most affected by drought. The number of contest entries yielding over 300 bu/acre hit a new record high in 2023 with 431, topping the previous high of 418 entries set in 2021 and up sharply from 282 in 2022 (Figure 1)
Thirteen states set new records for 300 bu/acre entries, including Minnesota, Iowa, Wisconsin, where corn yields overall were flat or down due to drought (Table 1). One of the biggest changes compared to 2022 was in Nebraska, where the number of 300 bu/acre entries was down sharply following two consecutive years of very strong performance.
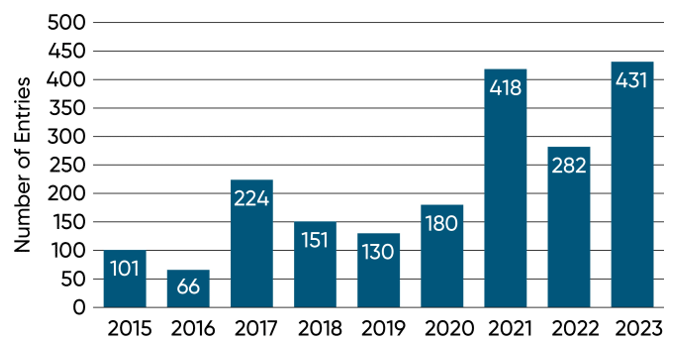
Figure 1. Total entries in the NCGA National Corn Yield Contest exceeding 300 bu/acre by year from 2015 to 2023.
Table 1. Number of NCGA National Corn Yield Contest entries over 300 bu/acre by state, 2019 - 2023.
|
| ||||||||||||||||||||||||||||||||||||||||||||||||||||||||||||||||||||||||||||||||||||||||||||||||||||||||||||||||||||||||||||||||||||||||||||||||||||||||||||||||||||||||||||||||||||||||||||||||||||||||||||||||||||||||||||||||||||||||||||||||||||||||||||
*New Record
Also, of note in the 2023 contest was the continued increase in high yields in northern geographies with shorter CRM hybrids. North Dakota and Montana both had their first-ever 300 bu/acre contest entries in 2023. A total of 13 entries topped 300 bu/acre using Pioneer® brand corn products with maturity under 100 CRM (Table 2).
Pioneer® brand products were used in 176 NCGA National Corn Yield Contest entries that topped 300 bu/acre in 2023, as well as 205 state-level winners. State-level winners included a total of 81 different Pioneer brand products from 62 different hybrid families ranging from 91 to 120 CRM (See tables below).
Yields exceeding 300 bu/acre have been achieved using Pioneer® brand products from 82 different hybrid families over the past five years, ranging from 91 to 120 CRM. The top-performing Pioneer hybrid families in the National Corn Yield Contest are shown in Table 2. The Pioneer brand P14830 family of products had the most 300 bu/acre entries in the 2023 contest, supplanting the P1185 family, which was the top performer the previous two years. Pioneer brand P14830, P1742, P0953, P1170, P1027, P0924, P1718 families all had 10 or more entries over 300 bu/acre in 2023.
Hybrid Selection
Hybrids tested against each other in a single environment (e.g., a university or seed company test plot) routinely vary in yield by at least 30 bu/acre. At contest yield levels, hybrid differences can be even higher. That is why selecting the right hybrid is likely the most important management decision of all those made by contest winners.
The yield potential of many hybrids now exceeds 300 bu/acre. Realizing this yield potential requires matching hybrid characteristics with field attributes, such as moisture supplying capacity; insect and disease spectrum and intensity; maturity zone, residue cover; and even seedbed temperature. To achieve the highest possible yields, growers should select a hybrid with:
- Top-end yield potential. Examine yield data from multiple, diverse environments to identify hybrids with highest yield potential..
- Full maturity for the field. Using all of the available growing season is a good strategy for maximizing yield.
- Good emergence under stress. This helps ensure uniform stand establishment and allows earlier planting, which moves pollination earlier to minimize stress during this critical period.
- Above-average drought tolerance. This will provide insurance against periods of drought that most non-irrigated fields experience.
- Resistance to local diseases. Leaf, stalk, and ear diseases disrupt normal plant function, divert plant energy, and reduce standability and yield.
- Traits that provide resistance to major insects, such as corn borer, corn rootworm, black cutworm, and western bean cutworm. Insect pests reduce yield by decreasing stands, disrupting plant functions, feeding on kernels, and increasing lodging and dropped ears. Protection against root-feeding insects is particularly important under drought conditions.
- Good standability to minimize harvest losses.
Table 2. Pioneer hybrid families with the most entries over 300 bu/acre in the 2023 NCGA National Corn Yield Contest.
| Hybrid Family | 2019 | 2020 | 2021 | 2022 | 2023 | 2019-2023 |
|---|---|---|---|---|---|---|
| —————— Number of Entries —————— | ||||||
| P14830 | 24 | 24 | ||||
| P1742 | 8 | 20 | 28 | |||
| P0953 | 11 | 10 | 17 | 38 | ||
| P1170 | 5 | 17 | 22 | |||
| P1027 | 13 | 13 | ||||
| P0924 | 4 | 6 | 10 | 20 | ||
| P1718 | 9 | 10 | 19 | |||
| P1185 | 10 | 29 | 20 | 5 | 64 | |
| P1136 | 4 | 5 | 9 | |||
| P1383 | 3 | 5 | 8 | |||
| P1278 | 2 | 5 | 7 | |||
| P1366 | 9 | 3 | 6 | 4 | 22 | |
| P0529 | 4 | 4 | ||||
| P1828 | 4 | 6 | 5 | 4 | 3 | 22 |
| P0035 | 3 | 3 | ||||
| P1563 | 1 | 11 | 22 | 15 | 2 | 51 |
| P1506 | 1 | 4 | 2 | 7 | ||
| P1222 | 5 | 6 | 2 | 13 | ||
| P9998 | 3 | 2 | 1 | 2 | 8 | |
| P13476 | 2 | 2 | ||||
| P1608 | 2 | 2 | ||||
| P9492 | 2 | 2 | ||||
| P9540 | 2 | 2 | ||||
| P1197 | 11 | 6 | 8 | 2 | 1 | 28 |
| P1572 | 6 | 7 | 4 | 1 | 18 | |
| P1108 | 1 | 3 | 10 | 2 | 1 | 17 |
| P0720 | 3 | 3 | 1 | 7 | ||
| P1370 | 2 | 2 | 1 | 5 | ||
| P1359 | 1 | 6 | 4 | 1 | 12 | |
| P2042 | 5 | 10 | 1 | 16 | ||
| P0817 | 1 | 2 | 1 | 4 | ||
| P00177 | 1 | 1 | ||||
| P0404 | 1 | 1 | ||||
| P10811 | 1 | 1 | ||||
| P1413 | 1 | 1 | ||||
| P1457 | 1 | 1 | ||||
| P1511 | 1 | 1 | ||||
| P9193 | 1 | 1 | ||||
High-Yield Management Practices
Top performers in the NCGA yield contest not only have produced yields much higher than the current U.S. average; they have also achieved a higher rate of yield gain over time. Over the past 20 years, U.S. corn yields have increased at a rate of 1.6 bu/acre per year while winning yields in the non-irrigated yield contest classes have increased by 4.5 bu/acre per year (Figure 2). Contest fields are planted with the same corn hybrids available to everyone and are subject to the same growing conditions, which suggests that management practices are playing a key role in capturing more yield potential. The following sections will discuss management practices employed in contest entries yielding above 300 bu/acre.
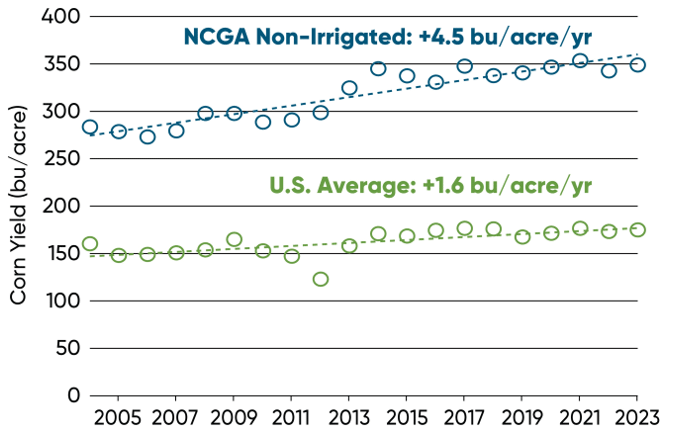
Figure 2. Average yields of NCGA National Corn Yield contest non-irrigated class national winners and U.S. average corn yields, 2004-2023.
Planting Practices
Plant Population
One of the most critical factors in achieving high corn yields is establishing a sufficient population density to allow a hybrid to maximize its yield potential. Historically, population density has been the main driver of yield gain in corn – improvement of corn hybrid genetics for superior stress tolerance has allowed hybrids to be planted at higher plant populations and produce greater yields.
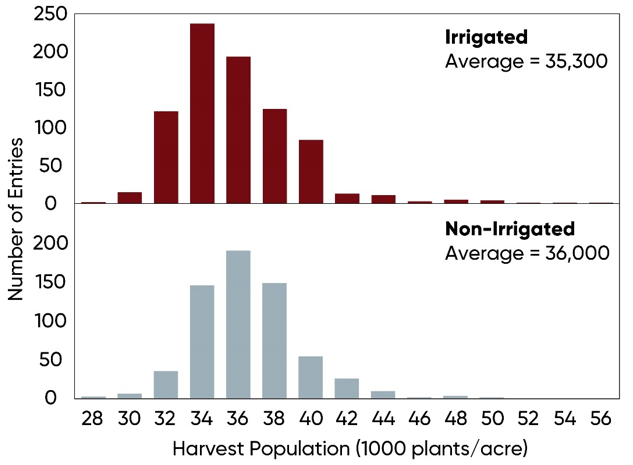
Figure 3. Harvest populations and corn yield of irrigated and non-irrigated NCGA National Corn Yield Contest entries exceeding 300 bu/acre, 2019-2023.
Harvest populations in irrigated and non-irrigated national corn yield contest entries over 300 bu/acre from 2019 through 2023 are shown in Figure 3. The average harvest population of non-irrigated entries (36,000 plants/acre) was slightly greater than that of irrigated entries (35,300 plants/acre) over five years. Both are well above the USDA average plant population of 29,200 plants/acre, as would be expected for high-yielding environments. However, yields over 300 bu/acre were achieved over a wide range of populations, from 27,000 to 56,000 plants/acre, demonstrating that exceptionally high populations are not necessarily a prerequisite for high yields. Although population density is important in establishing the yield potential of a corn crop, it is just one of many factors that determine yield.
Planting Date
High-yielding contest plots are usually planted as early as practical for their geography. Early planting lengthens the growing season and, more importantly, moves pollination earlier. When silking, pollination and early ear fill are accomplished in June or early July, heat and moisture stress effects can be reduced.
The range of planting dates for contest entries exceeding 300 bu/acre in several states is shown in Figure 4, as well as the mid-point of corn planting progress according to USDA NASS for reporting states. Average planting dates for 300 bu/acre entries in 2023 was generally mid-April for Southern and East Coast states and late-April through early-May for Corn Belt states. The 2023 contest had several high-yield entries planted in mid- to late-May and even early June, demonstrating that high yields can still be achieved under favorable conditions if planting is not delayed for too long. However, the odds of achieving high yields are generally going to be better with earlier planting.
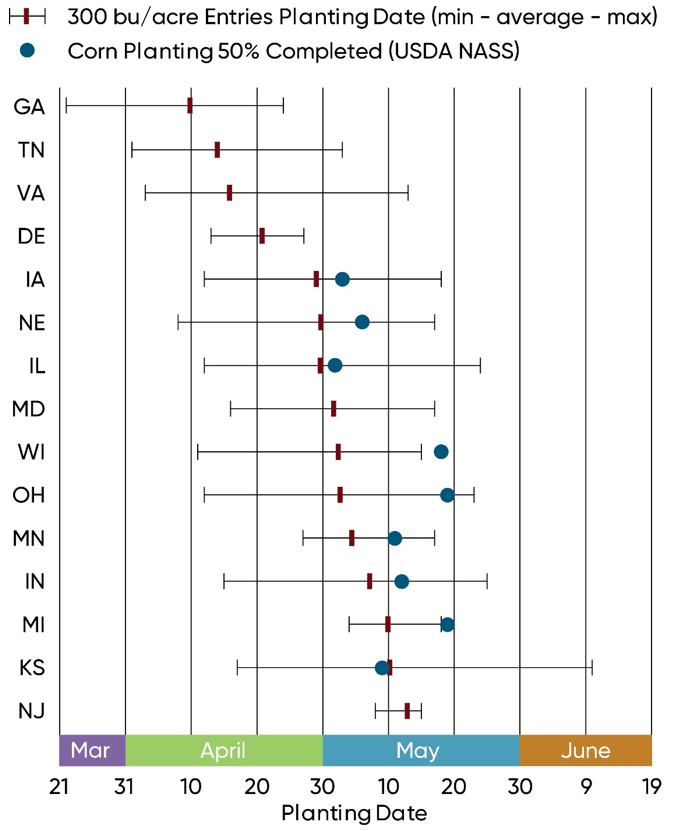
Figure 4. Average planting date and planting date range of NCGA National Corn Yield Contest entries exceeding 300 bu/acre in 2023 in select states.
Row Spacing
The vast majority of corn acres in the U.S. are currently planted in 30-inch rows, accounting for around 80% of corn production. A majority of 300 bu/acre contest entries over the past five years have been planted in 30-inch rows (Figure 5). This proportion has increased slightly in recent years as wider row configurations (most commonly 36-inch or 38-inch) have remained steady and narrower row configurations (15-inch, 20-inch, 22-inch or 30-inch twin) have declined.
Row spacings narrower than the current standard of 30 inches have been a source of continuing interest as a way to achieve greater yields, particularly with continually increasing seeding rates. However, research has generally not shown a consistent yield benefit to narrower rows outside of the northern Corn Belt (Jeschke, 2018).
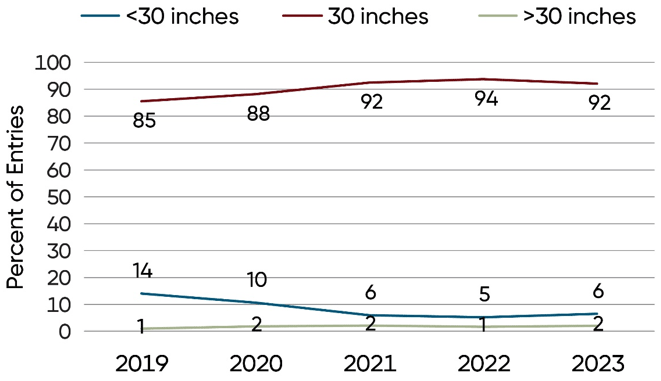
Figure 5. Row width used in NCGA National Corn Yield Contest entries exceeding 300 bu/acre, 2019-2023.
Crop Rotation
Rotating crops is one of the practices most often recommended to keep yields consistently high. Rotation can break damaging insect and disease cycles that lower crop yields. Including crops like soybean or alfalfa in the rotation can reduce the amount of nitrogen required in the following corn crop. A majority of the fields in the 300 bu/acre entries were planted to a crop other than corn the previous growing season (Figure 6).
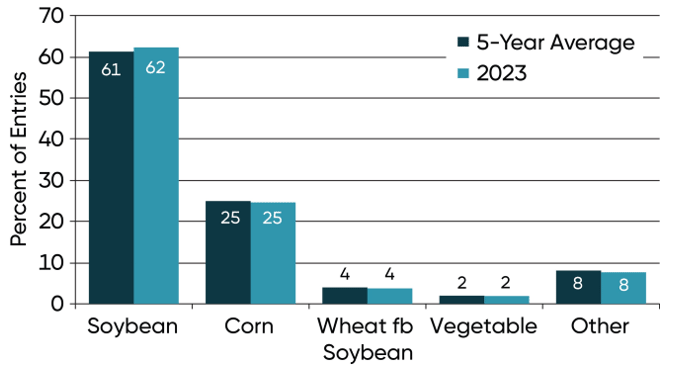
Figure 6. Previous crop in NCGA National Corn Yield Contest entries exceeding 300 bu/acre in 2023 and 5-year averages.
The so-called “rotation effect” is a yield increase associated with crop rotation compared to continuous corn even when all limiting factors appear to have been controlled or adequately supplied in the continuous corn. This yield increase has averaged about 5 to 15 percent in research studies but has generally been less under high-yield conditions (Butzen, 2012). Rotated corn is generally better able to tolerate yield-limiting stresses than continuous corn; however, yield contest results clearly show that high yields can be achieved in continuous-corn production.
Tillage
Over the past five years, around 40% of the high yield entries in the NCGA contest have used conventional tillage, with the other half using no-tillage or some form of reduced tillage (Figure 7). Tillage practices in 2023 did not differ much from 5-year averages; however, over a longer timeframe, the proportion of high-yield entries using conventional tillage has declined, offset by increases in no-till and strip-till.
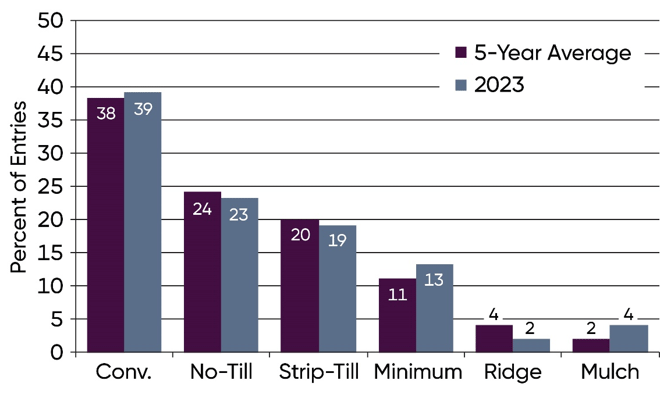
Figure 7. Tillage practices in NCGA National Corn Yield Contest entries exceeding 300 bu/acre in 2023 and 5-year averages.
Nutrient Management
Achieving highest corn yields requires an excellent soil fertility program, beginning with timely application of nitrogen (N) and soil testing to determine existing levels of phosphorous (P), potassium (K), and soil pH.
Nitrogen
Corn grain removes approximately 0.67 lbs of nitrogen per bushel harvested, and stover production requires about 0.45 lbs of nitrogen for each bushel of grain produced (IPNI, 2014). This means that the total N needed for a 300 bu/acre corn crop is around 336 lbs/acre. Only a portion of this amount needs to be supplied by N fertilizer; N is also supplied by the soil through mineralization of soil organic matter. On highly productive soils, N mineralization will often supply the majority of N needed by the crop. Credits can be taken for previous legume crop, manure application, and N in irrigation water. Nitrogen application rates of entries exceeding 300 bu/acre are shown in Figure 8. Numbers are based on 353 entries that reported N application rates and include fertilizer N as well as estimated N from reported manure applications.
Nitrogen Rates
The N application rates of 300 bu/acre entries varied greatly, but the majority were in the range of 200 to 300 lbs/acre (Figure 8). As corn yield increases, more N is removed from the soil; however, N application rates do not necessarily need to increase to support high yields. Climatic conditions that favor high yield will also tend to increase the amount of N a corn crop obtains from the soil through increased mineralization of organic N and improved root growth. Total nitrogen applied in high yield entries has trended downward in recent years. In the 2016 contest, over half of high yield entries had over 300 lbs/acre of N applied, compared to one third of entries in 2023.
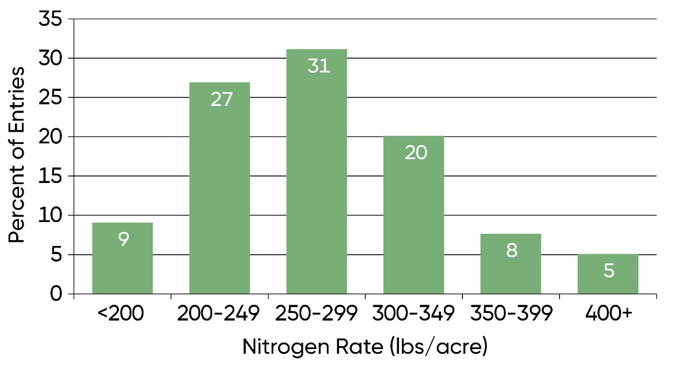
Figure 8. Nitrogen rates (total lbs/acre of fertilizer and manure N applied) of NCGA National Corn Yield Contest entries exceeding 300 bu/acre in 2023.
Nitrogen Timing
Timing of N fertilizer applications can be just as important as application rate. The less time there is between N application and crop uptake, the less likely N loss from the soil will occur and limit crop yield. Nitrogen uptake by the corn plant peaks during the rapid growth phase of vegetative development between V12 and VT (tasseling). However, the N requirement is high beginning at V6 and extending to the R5 (early dent) stage of grain development.
Timing of N fertilizer applications in 300 bu/acre entries is shown in Figure 9. Very few included fall-applied N. Many applied N before or at planting. Nearly 75% of 300 bu/acre entries included some form of in-season nitrogen, either side-dressed or applied with irrigation. Multiple nitrogen applications were used in over 75% of high-yield entries.
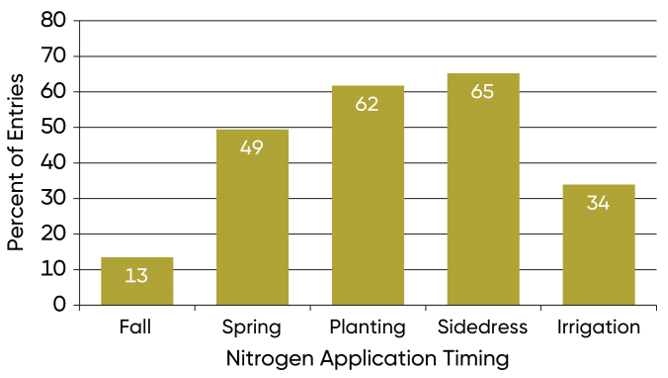
Figure 9. Nitrogen fertilizer application timing of NCGA National Corn Yield Contest entries exceeding 300 bu/acre in 2023.
New Nitrogen Management Class
A new feature of the NCGA National Corn Yield Contest in 2023 was the addition of the Nitrogen Management Class (Class J). Entrants in this class were required to limit total nitrogen applications from non-field sources to 180 lbs/acre of actual nitrogen applied. For the initial year, this class was limited to 100 total entrants from select Corn Belt states. Rules for this class also placed limits based on previous crop, with only fields planted to corn, soybean, wheat, or a wheat followed by soybean double crop eligible for entry.
The Nitrogen Management Class had 15 entries reporting yield in 2023. Of these 15 entries, 3 were able to top 300 bu/acre while applying no more than 180 lbs/acre of N.
Secondary and Micronutrients
Around 40% of 300 bu/acre entries reported applying one or more secondary or micronutrients. Sulfur (S) was the most commonly applied nutrient, followed by zinc (Zn), and boron (B), and a smaller number of entries included magnesium (Mg), manganese (Mn), or copper (Cu). Micronutrients are sufficient in many soils to meet crop needs. However, some sandy soils and other low organic matter soils are naturally deficient in micronutrients, and high pH soils may reduce their availability (Butzen and Jeschke, 2022). Additionally, as yields increase, micronutrient removal increases as well, potentially causing deficiencies.
Video: The Secret to Breaking 300 bu/A
Pioneer Winners (AL - ID)
2023 NCGA National Corn Yield Contest state-level winners using Pioneer® brand products.
(Alabama - Idaho)
| Hybrid/Brand1 | Winners |
|---|---|
| Alabama | |
| P1464VYHR (AVBL, YGCB, HX1, LL, RR2) | 1 |
| P1847VYHR (AVBL, YGCB, HX1, LL, RR2) | 1 |
| Arkansas | |
| P17052YHR (YGCB, HX1, LL, RR2) | 1 |
| P1718VYHR (AVBL, YGCB, HX1, LL, RR2) | 1 |
| California | |
| P1222 | 1 |
| P1718AML™ (AML, LL, RR2) | 1 |
| Colorado | |
| P0075AM™ (AM, LL, RR2) | 2 |
| P0622AML™ (AML, LL, RR2 | 2 |
| P0859AM™ (AM, LL, RR2) | 1 |
| P1278Q™ (Q, LL, RR2) | 1 |
| Delaware | |
| P1136AM™ (AM, LL, RR2) | 1 |
| P1464AML™ (AM, LL, RR2) | 1 |
| P1718AML™ (AM, LL, RR2) | 1 |
| P17677AM™ (AM, LL, RR2) | 1 |
| Florida | |
| P1847VYHR (AVBL, YGCB, HX1, LL, RR2) | 3 |
| P1870R (RR2) | 1 |
| Georgia | |
| P1511AM™ (AM, LL, RR2) | 1 |
| P1608YHR (YGCB, HX1, LL, RR2) | 1 |
| P1870YHR (YGCB, HX1, LL, RR2) | 1 |
| Iowa | |
| P1027AM™ (AM, LL, RR2) | 5 |
| P1170AM™ (AM, LL, RR2) | 2 |
| P1222AM™ (AM, LL, RR2) | 1 |
| P1366Q™ (Q, LL, RR2) | 1 |
| P1457WAM™ (AM, LL, RR2) | 1 |
| P1742Q™ (Q, LL, RR2) | 1 |
| Idaho | |
| P0924Q™ (Q, LL, RR2) | 1 |
| P0953AM™ (AM, LL, RR2) | 1 |
| P1185 | 1 |
Pioneer Winners (IL - MO)
2023 NCGA National Corn Yield Contest state-level winners using Pioneer® brand products.
(Illinois - Missouri)
| Hybrid/Brand1 | Winners |
|---|---|
| Illinois | |
| P1027AM™ (AM, LL, RR2) | 1 |
| P14830Q™ (Q, LL, RR2) | 1 |
| P1718AML™ (AML, LL, RR2) | 1 |
| P1742Q™ (Q, LL, RR2) | 1 |
| Indiana | |
| P1383AM™ (AM, LL, RR2) | 1 |
| P14830AML™ (AML, LL, RR2) | 3 |
| Kansas | |
| P1122AML™ (AML, LL, RR2) | 1 |
| P1170AM™ (AM, LL, RR2) | 1 |
| P1370Q™ (Q, LL, RR2) | 1 |
| P1413AM™ (AM, LL, RR2) | 1 |
| P1548AM™ (AM, LL, RR2) | 1 |
| P1718AML™ (AML, LL, RR2) | 1 |
| P1742Q™ (Q, LL, RR2) | 2 |
| P1828AM™ (AM, LL, RR2) | 1 |
| Kentucky | |
| P1359AM™ (AM, LL, RR2) | 1 |
| P1718AML™ (AML, LL, RR2) | 1 |
| Maryland | |
| P0953AM (AM, LL, RR2) | 1 |
| P14830AML (AML, LL, RR2) | 1 |
| P1587Q™ (Q, LL, RR2) | 1 |
| Massachusetts | |
| P0035Q™ (Q, LL, RR2) | 1 |
| P0487Q™ (Q, LL, RR2) | 1 |
| Michigan | |
| P0953AM™ (AM, LL, RR2) | 5 |
| P1506YHR™ (YGCB, HX1, LL, RR2) | 1 |
| Minnesota | |
| P00177V (V) | 1 |
| P0859AM™ (AM, LL, RR2) | 1 |
| P0924Q (Q, LL, RR2) | 1 |
| P0953AM™ (AM, LL, RR2) | 4 |
| P1027AM (AM, LL, RR2) | 2 |
| Missouri | |
| P1170AM™ (AM, LL, RR2) | 2 |
| P14830AML™ (AML, LL, RR2) | 1 |
| P1718AML™ (AML, LL, RR2) | 1 |
Pioneer Winners (MS - NV)
2023 NCGA National Corn Yield Contest state-level winners using Pioneer® brand products. (Mississippi - Nevada)
| Hybrid/Brand1 | Winners |
|---|---|
| Mississippi | |
| P0953YHR™ (YGCB, HX1, LL, RR2) | 1 |
| P1511YHR™ (YGCB, HX1, LL, RR2) | 1 |
| P1870R (RR2) | 1 |
| Montana | |
| P9193AM™ (AM, LL, RR2) | 2 |
| P9301Q™ (Q, LL, RR2) | 1 |
| P9489Q™ (Q, LL, RR2) | 2 |
| North Carolina | |
| P1718AML™ (AML, LL, RR2) | 2 |
| P1903YHR (YCGB,, HX1, LL, RR2) | 1 |
| North Dakota | |
| P9492AM™ (AM, LL, RR2) | 1 |
| P9540AM™ (AM, LL, RR2) | 2 |
| Nebraska | |
| P1170AM™ (AM, LL, RR2) | 4 |
| P1278Q™ (Q, LL, RR2) | 1 |
| P1563AML™ (AML, LL, RR2) | 1 |
| P1718AML™ (AML, LL, RR2) | 1 |
| P1742Q™ (Q, LL, RR2) | 5 |
| New Jersey | |
| P0035AM™ (AM, LL, RR2) | 3 |
| P1136AM™ (AM, LL, RR2) | 1 |
| P1197AM™ (AM, LL, RR2) | 1 |
| P14830AML™ (AML, LL, RR2) | 1 |
| New Mexico | |
| P0075AM™ (AM, LL, RR2) | 1 |
| P1366Q™ (Q, LL, RR2) | 1 |
| P1370Q™ (Q, LL, RR2) | 1 |
| P1572AM™ (AM, LL, RR2) | 1 |
| New York | |
| P0035Q™ (Q, LL, RR2) | 1 |
| P0075AM™ (AM, LL, RR2) | 1 |
| P0732Q™ (Q, LL, RR2) | 1 |
| P0859AM™ (AM, LL, RR2) | 1 |
| P0947Q™ (Q, LL, RR2) | 1 |
| Nevada | |
| P0035AM™ (AM, LL, RR2) | 1 |
| P9998AM™ (AM, LL, RR2) | 1 |
Pioneer Winners (OH - VA)
2023 NCGA National Corn Yield Contest state-level winners using Pioneer® brand products. (Ohio - Virginia)
| Hybrid/Brand1 | Winners |
|---|---|
| Ohio | |
| P0953AM™ (AM, LL, RR2) | 1 |
| P1197AM™ (AM, LL, RR2) | 1 |
| P1383AM™ (AM, LL, RR2) | 1 |
| P1506AM™ (AM, LL, RR2) | 1 |
| P1587Q™ (Q, LL, RR2) | 1 |
| Oklahoma | |
| P1359AM™ (AM, LL, RR2) | 1 |
| P1366AML™ (AML, LL, RR2) | 1 |
| P1572AM™ (AM, LL, RR2) | 1 |
| P1718VYHR (AVBL, YGCB, HX1, LL, RR2) | 1 |
| P1828AM™ (AM, LL, RR2) | 2 |
| P1828Q™ (Q, LL, RR2) | 2 |
| P1847VYHR (AVBL, YGCB, HX1, LL, RR2) | 1 |
| Oregon | |
| P0720AM™ (AM, LL, RR2) | 1 |
| P0953AM™ (AM, LL, RR2) | 2 |
| Pennsylvania | |
| P0924Q™ (Q, LL, RR2) | 2 |
| P0953AM™ (AM, LL, RR2) | 1 |
| P1136AM™ (AM, LL, RR2) | 3 |
| P1383AM™ (AM, LL, RR2) | 1 |
| P14830Q™ (Q, LL, RR2) | 2 |
| P1608AM™ (AM, LL, RR2) | 1 |
| P1718AML™ (AML, LL, RR2) | 1 |
| South Carolina | |
| P1847VYHR (AVBL, YGCB, HX1, LL, RR2) | 1 |
| P2042VYHR (AVBL, YGCB, HX1, LL, RR2) | 2 |
| South Dakota | |
| P0404Q™ (Q, LL, RR2) | 1 |
| P0421AM™ (AM, LL, RR2) | 1 |
| P05737AM™ (AM, LL, RR2) | 1 |
| P0688AM™ (AM, LL, RR2) | 1 |
| P0924Q™ (Q, LL, RR2) | 1 |
| P1185AM™ (AM, LL, RR2) | 1 |
| P1244AM™ (AM, LL, RR2) | 1 |
| P1366AM™ (AM, LL, RR2) | 1 |
| P14830Q™ (Q, LL, RR2) | 2 |
| Texas | |
| P1359 | 1 |
| P1366AML™ (AML, LL, RR2) | 1 |
| P1370Q™ (Q, LL, RR2) | 1 |
| P1828AM™ (AM, LL, RR2) | 2 |
| P1847VYHR (AVBL, YGCB, HX1, LL, RR2) | 1 |
| Utah | |
| P0953AM™ (AM, LL, RR2) | 2 |
| Virginia | |
| P10811AM™ (AM, LL, RR2) | 1 |
| P1136AM™ (AM, LL, RR2) | 1 |
| P14830VYHR (AVBL, YCGB, HX1, LL, RR2) | 1 |
| P1608AM™ (AM, LL, RR2) | 1 |
| P1847AML™ (AML, LL, RR2) | 1 |
Pioneer Winners (VT - WY)
2023 NCGA National Corn Yield Contest state-level winners using Pioneer® brand products. (Vermont - Wyoming)
| Hybrid/Brand1 | Winners |
|---|---|
| Vermont | |
| P0035Q™ (Q, LL, RR2) | 1 |
| P0487Q™ (AM, LL, RR2) | 1 |
| P9823Q™ (AM, LL, RR2) | 1 |
| Washington | |
| P9998 | 1 |
| Wisconsin | |
| P0035AM™ (AM, LL, RR2) | 1 |
| P0421AM™ (AM, LL, RR2) | 1 |
| P0529Q™ (AM, LL, RR2) | 3 |
| P0924Q™ (AM, LL, RR2) | 2 |
| P1027AM™ (AM, LL, RR2) | 1 |
| P1185Q™ (AM, LL, RR2) | 1 |
| West Virginia | |
| P0924Q™ (Q, LL, RR2) | 1 |
| P1136AM™ (AM, LL, RR2) | 1 |
| P1170AM™ (Q, LL, RR2) | 1 |
| P1289AM™ (AM, LL, RR2) | 1 |
| P1506AM™ (AM, LL, RR2) | 1 |
| Wyoming | |
| P0339Q (AVBL, YGCB, HX1, LL, RR2) | 2 |
| P0404AM (AVBL, YGCB, HX1, LL, RR2) | 1 |
| P9188AM (AVBL, YGCB, HX1, LL, RR2) | 1 |
| P9540AM (AVBL, YGCB, HX1, LL, RR2) | 1 |
| P9551Q (AVBL, YGCB, HX1, LL, RR2) | 1 |
| P9823Q (AVBL, YGCB, HX1, LL, RR2) | 1 |
References
- Butzen, S. and M. Jeschke 2022. Micronutrients for crop production. Crop Insights Vol. 32. No. 2. Corteva Agriscience. Johnston, IA.
- Butzen, S. 2012. Best management practices for corn-after-corn production. Crop Insights Vol. 22. No. 6. Corteva Agriscience. Johnston, IA.
- IPNI. 2014. IPNI Estimates of Nutrient Uptake and Removal.
- Jeschke, M. 2018. Row width in corn grain production. Crop Insights Vol. 28. No. 3. Corteva Agriscience. Johnston, IA.